These are the series of the following charts, I wanted to build in which it is clear that the Value (Blue) is fixed upon which the sliding series is the Slide Value (Grey):

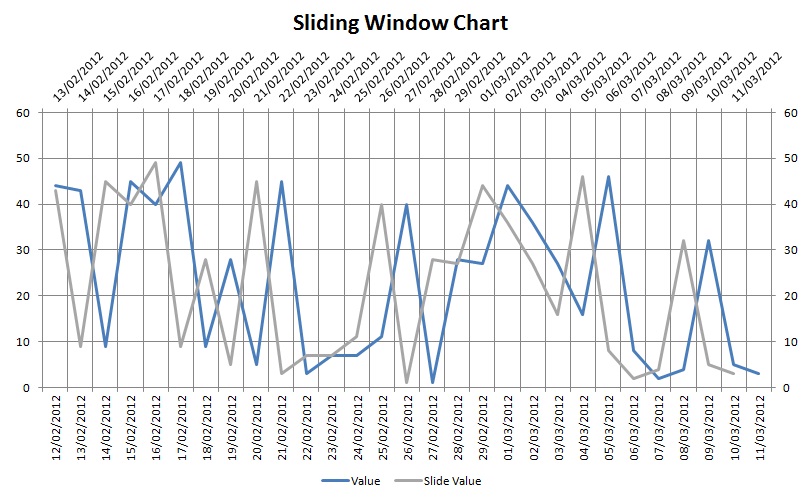
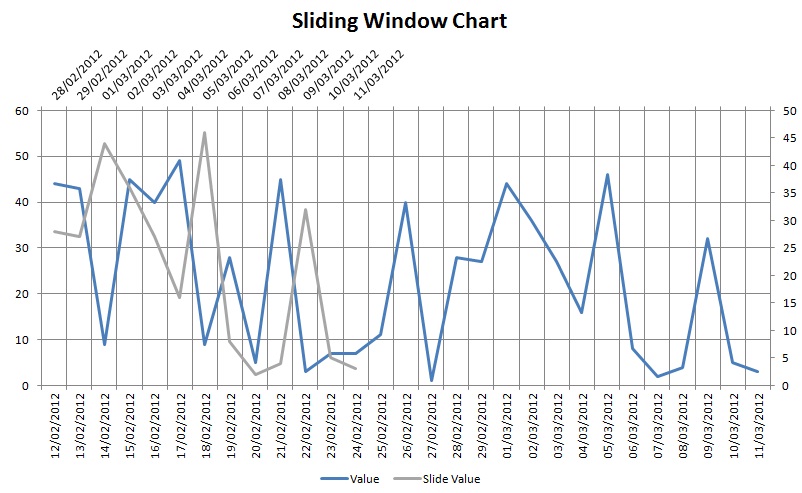

The attached spreadsheet illustrates the complete mechanism of building the same, it uses couple of excel formulas and a form control slider. The slider in the workbook allows the flexibility to slide the time series in both forward and backward equally to the original count of the series points available. Additionally in spreadsheet there are no macros, all the functionality is built via default excel provided formulas and also had to use couple of na() formulas for chart to appear as required.
This technique can also be used to analyse additional statistics based upon sliding series. E.g. Max, Min, Average, Standard Deviation and more…
Feel free to contact me for more info upon its design.
Download:

Download solution
No comments:
Post a Comment